🦉 Hibou
Clear ESG information across countries through a global sustainability dashboard.
Overview
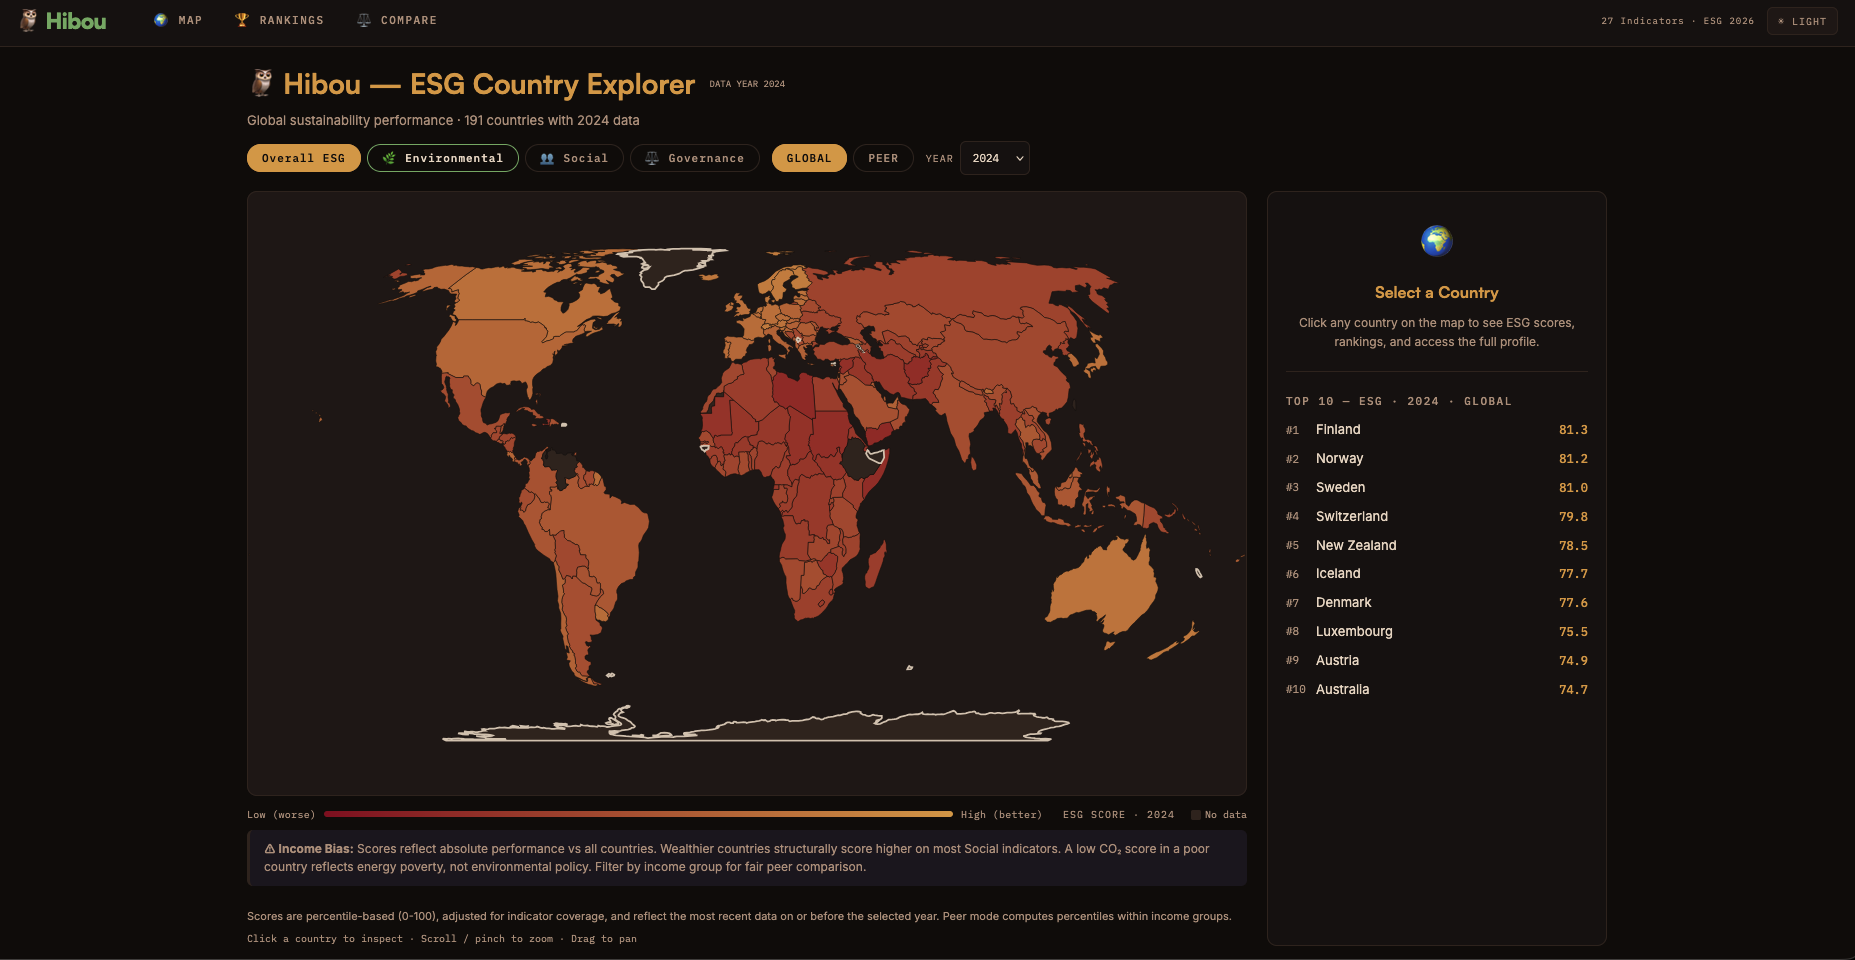
Hibou provides clear, country-by-country ESG information through a global dashboard.
Problem
Reliable ESG data is scattered across sources, making it hard to compare countries and extract insights quickly.
Target Users
- Sustainability analysts and researchers
- Policy and public-sector teams
- Product teams looking for global ESG context
Goals
- Balance comparability with uneven data freshness
- Make cross-country signals readable without overpromising precision
- Reduce the effort to answer country-level ESG questions
Non-Goals
- Financial or investment advice
- Full reporting or audit workflows
- Predictive modeling
Solution
A live, interactive dashboard that aggregates 27 ESG indicators by country with clear visualizations and a simple query flow.
My Role
Personal case study. I owned the problem framing, indicator selection, UX flow, and end-to-end demo build, and indicator choice meant trading data freshness against comparability.
Key Decisions & Trade-offs
Focused on country-level ESG indicators for comparability over broader, harder-to-normalize datasets.
- Prioritized clarity and readability over exhaustive coverage.
- Balanced a global overview (map) with deep dives (country profiles).
Key Features
- Global map and country profiles
- ESG indicator exploration and comparisons
- Clear visual storytelling for sustainability data
AI Use
- LLM used to generate narrative summaries; the demo shows precomputed narratives.
- Core metrics come directly from published datasets.
Risks & Constraints
- Data freshness varies by source
- Cross-country comparisons require careful context
- Constraint: I only used public, unevenly updated ESG datasets, so I optimized for clarity over coverage.
What I’d Do Next
- If I restarted, I would start with fewer indicators and validate the data pipeline before expanding scope.
- Add methodology notes and sources per indicator.
- Introduce time-series trends for each country.
- Provide exports for analysts (CSV / report-ready visuals).
Status / Deployment
Real deployed demo. This instance reflects the product in a live environment.
Data Sources
- World Bank ESG Data Portal
- World Bank Data Catalog (ESG bulk CSV)
- Our World in Data, CO2 dataset
- World Development Indicators (WDI) API
- Worldwide Governance Indicators (WGI)
- Country Metadata
- RestCountries API